Create ggplot2 charts in the Grattan Institute style.
See the grattantheme vignette to learn how to make your ggplot2 charts Grattan-y with grattantheme.
See the Data Visualisation chapter of Using R at Grattan Institute for more about how to make great charts.
Install grattantheme
The grattantheme package needs to be downloaded and installed from Github. The easiest way to do this is with the pak package. If you don’t have the pak package, install it:
install.packages("pak")
Once pak is installed, you can download and install grattantheme as follows:
pak::pak("grattan/grattantheme")
pak installs the package’s dependencies for you, and will upgrade them where grattantheme needs a newer version.
Once grattantheme is installed, you can load it the same way you normally load an R package:
Make your charts look nice
See the grattantheme vignette for a more complete guide.
Use theme_grattan() to format your ggplot2 charts in a style consistent with the Grattan style guide, including elements such as gridline colours and line width, font size, etc. For scatter plots, theme_grattan(chart_type = "scatter") provides a black y-axis. For charts with discrete values on the y axis, theme_grattan(flipped = 'TRUE') provides a vertical axis line and rotates gridlines.
Use scale_y_continuous_grattan() (or scale_x_continuous_grattan if flipped) to set default values for your vertical axis that will work well with most Grattan charts.
The colours that will be used in your plot are:
#> grattantheme: Auto-detected a horizontal/flipped chart and applied `flipped = TRUE`. Set `theme_grattan(flipped = TRUE)` explicitly to silence this message.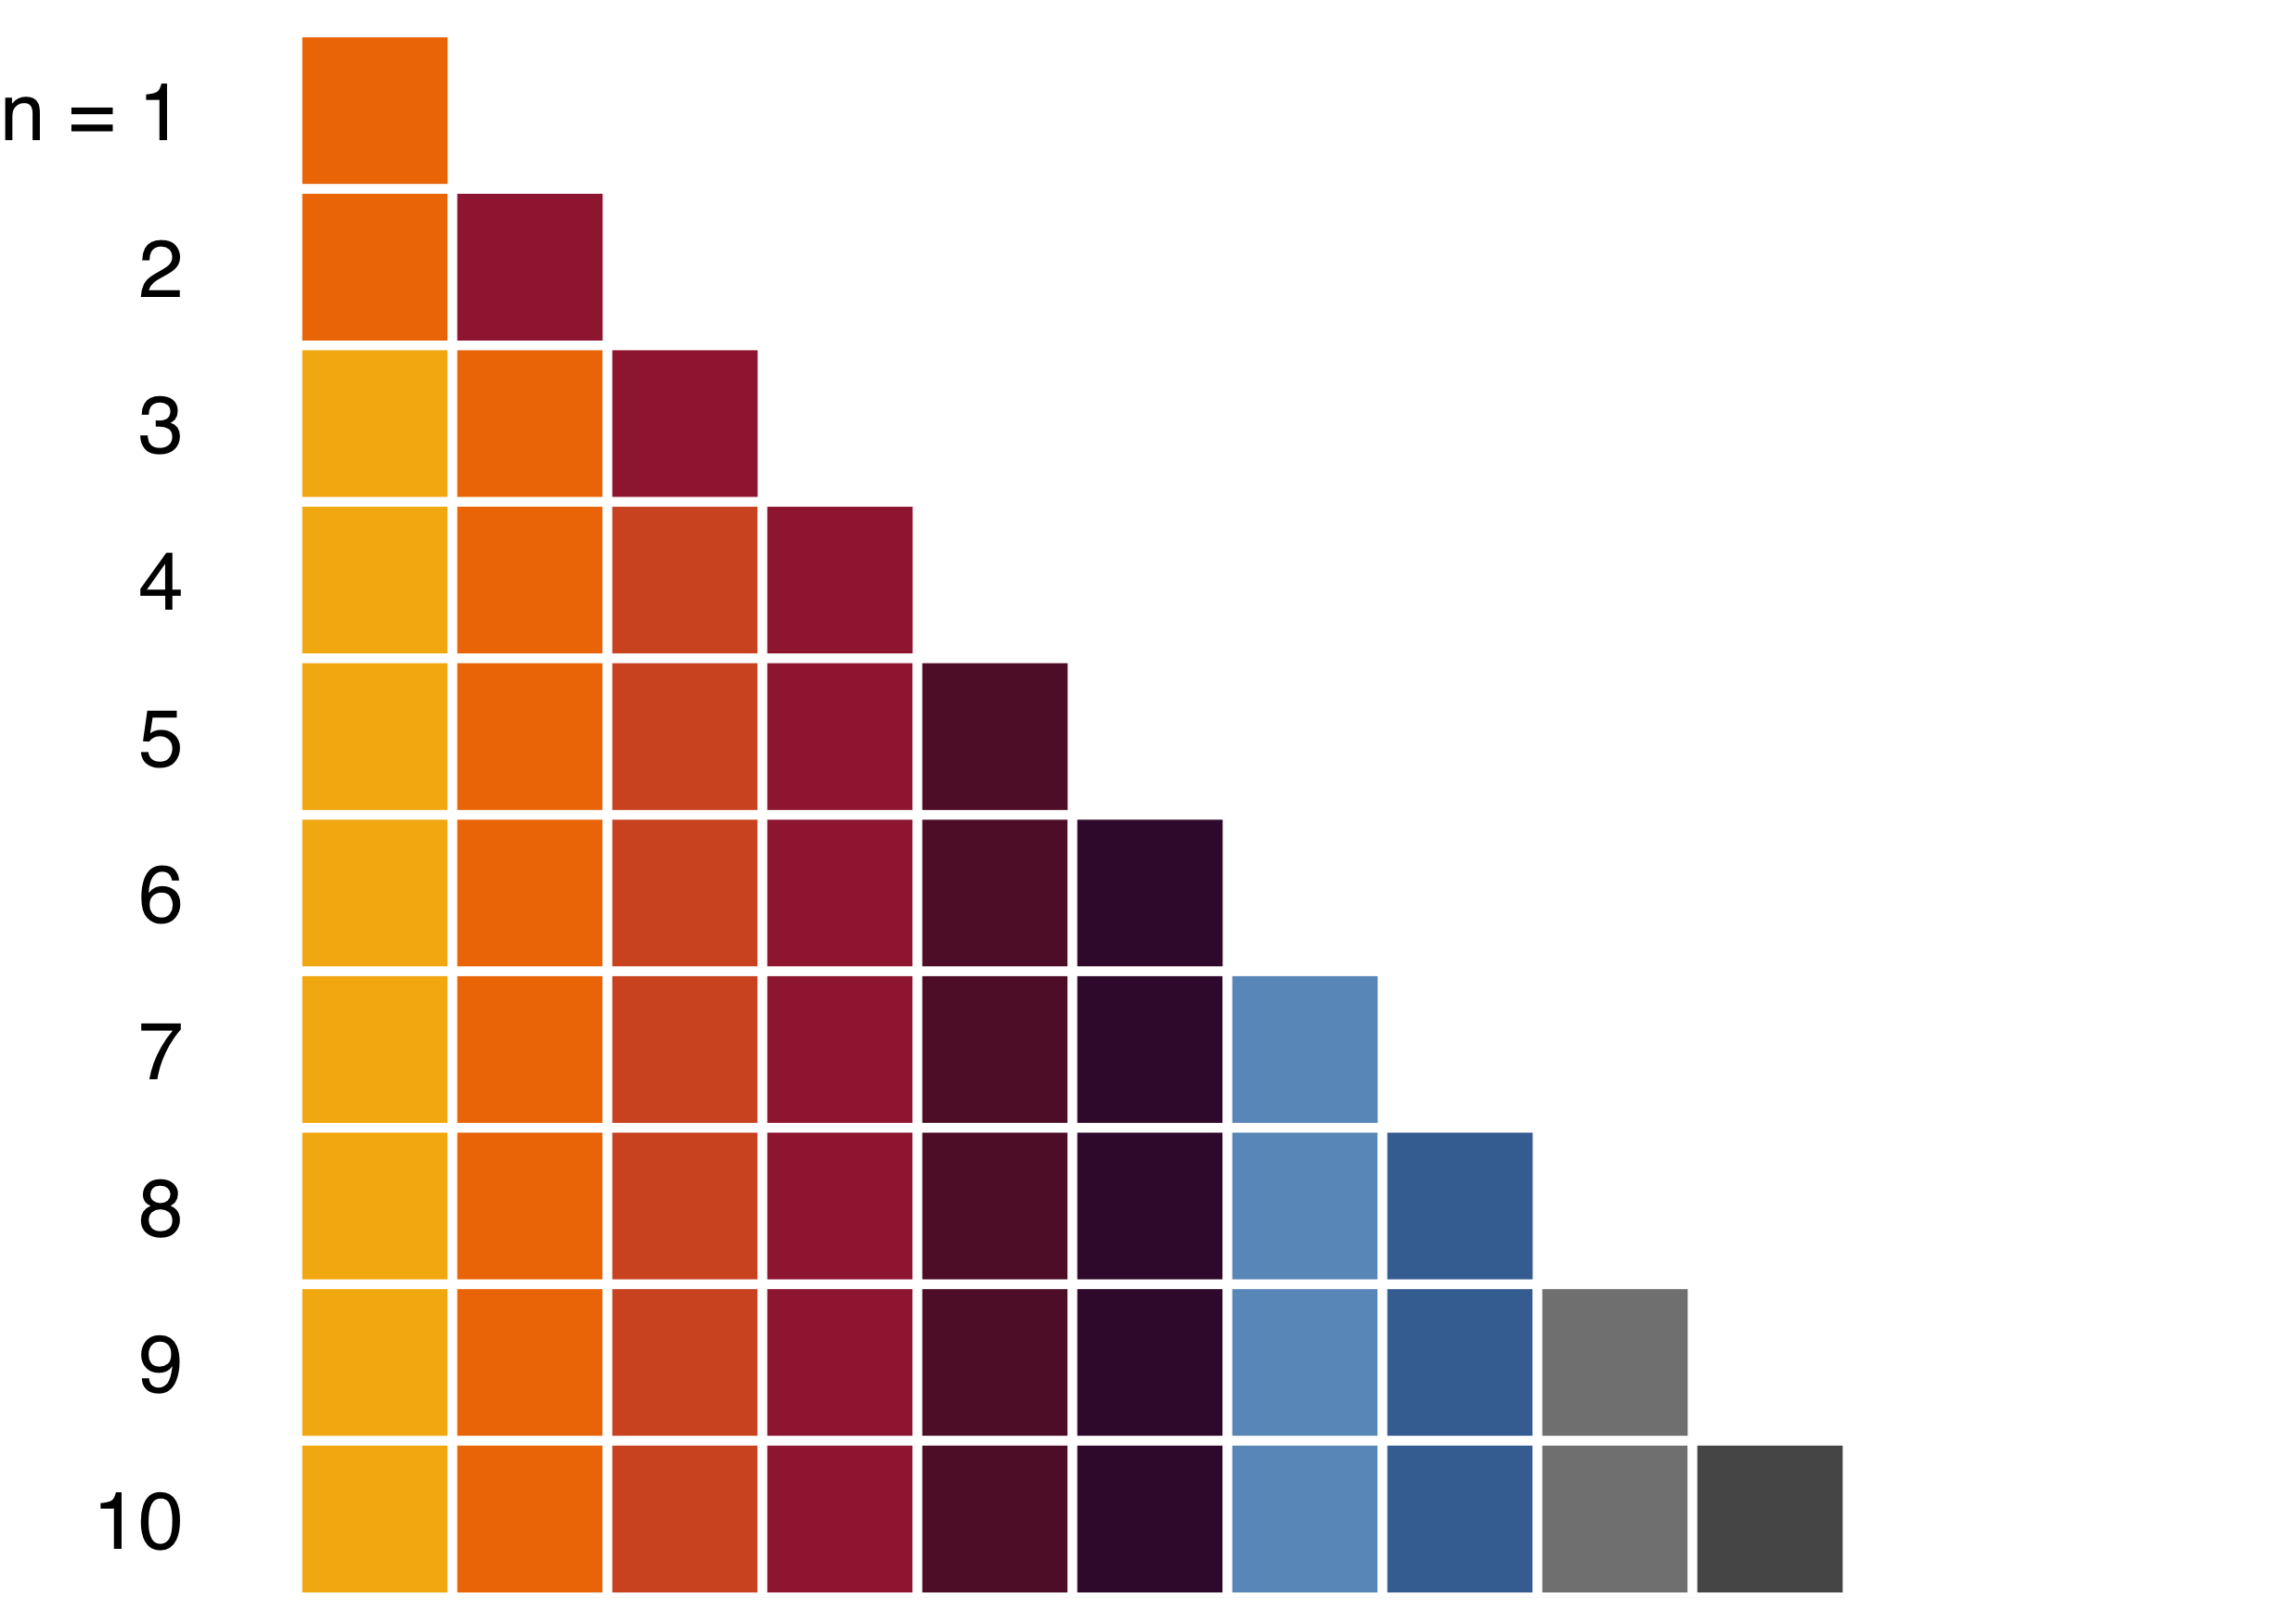
A range of colours from the style guide (such as grattan_orange, grattan_darkred, and so on) are defined for your convenience. Each colour has eight tints available, e.g. grattan_orange has lighter variants grattan_orange1 through grattan_orange8 (closest to white). These can be used to allow highlighting or when filling in block colours behind text, such as when designing tables.
Use theme_grattan(background = "box") to create a chart for a Grattan report box.
Add chart annotations and notes
Use grattan_label(), grattan_label_repel(), or grattan_arrow() to add style-guide consistent annotations to your chart.
Use grattan_richlegend() to put a coloured legend directly on your chart, rather than off to one side. Set legend.position to choose a corner of the panel, e.g. grattan_richlegend(aes(label = series), legend.position = "topright"). On a faceted chart the legend appears on the top-left panel by default; use facet = "all" to repeat it on every panel, or pass panel numbers such as facet = c(1, 3).
Use labs(caption = "Notes: Your notes. Source: Your source.") to add notes and sources, with text appropriately wrapped.
Check how your chart looks
Use check_chart() to create a temporary pop-up chart to inspect chart appearances at different aspect ratios.
Save your nice looking charts
Use grattan_save() to save your ggplot2 charts (eg. as .png or .pdf files) for use elsewhere, such as in Powerpoint or LaTeX with the size and resolution set to style guide-consistent values. You can save your charts in a variety of sizes and styles (see ?grattan_save() for a list).
Want to save your chart as a Powerpoint file? Use grattan_save(save_pptx = TRUE) or the standalone grattan_save_pptx() function.
Want to save your chart and accompanying data as a properly-formatted .xlsx workbook? Use grattan_save(save_data = TRUE) or the standalone save_chartdata() function.
Want a web-ready .png, using the fonts from the slide template? Use grattan_save(save_web = TRUE) or the standalone grattan_save_web() function.
Save your chart in all Grattan formats - along with chart data - using grattan_save_all().
Use set_overleaf_project("project_name") and then grattan_save_overleaf() to conveniently save your chart to an ongoing Overleaf report project.
Save animated charts
Use grattan_anim_save() to save gganimate animations formatted in the Grattan style.
Notes
Some graph defaults (such as colour) will be modified during your R session; restart R to restore all defaults.
Some manual modification to your chart will most likely be required in order to make it fully consistent with the style guide, just as it would in other visualisation software or Excel/Powerpoint.



