1 What is R and what is R Studio and why are we doing all of this
Most people reading this guide will know what R is. But if you don’t - that’s OK!
If you have used R before and are comfortable enough with it, you might want to skip to the next page. This page is intended for people who are unfamiliar with R. Soon, this will be you!
1.1 What is R?
R is a programming language. That sounds scarier than it really is! Don’t freak out. R is software you use to work with data, just like Excel, Stata, or SPSS.
R is available for Windows, macOS and Linux. One of R’s best features: it’s free!
One of R’s strengths is that it was designed by and for statisticians, data scientists, and other people who work with data. This can also be one of its weaknesses - statisticians aren’t always the best at designing software that’s easy to use out of the box.
R has a lot in common with other statistical software like SAS, Stata, SPSS or Eviews. You can use those software packages to read data, manipulate it, generate summary statistics, estimate models, and so on. You can use R for all those things and more. Everything you can do in Excel, you can (and generally should!) do in R. (See the next page for more on why we usually use R rather than Excel.)
You interact with R by writing code. This is a little different to Stata or SPSS (or Excel), which allow you to do at least part of your analyses by clicking on menus and buttons. This means the initial learning curve for R can be a little steeper than for something like SPSS, but there are great benefits to a code-based approach to data analysis (see the next page for more on this).
R is quite old, having been first released publicly in 1995, but it’s also growing and changing rapidly. A lot of developments in R come in the form of new add-on pieces of software - known as ‘packages’ - that extend R’s functionality in some way. We cover packages more later in this page.
To analyse data with R, you will typically write out a text file containing code. This file - which we’ll call a script - should be able to be read and executed by R from start to finish. Your script is like a recipe from a cookbook - it tells R all the steps that are needed to go from the raw ingredients (your data) to the finished product (the graphs or other finished product).
The easiest way to write your code, run your script, and generate your outputs (whether that’s a chart, a document, or a set of model results) is to use RStudio.
1.2 What is RStudio?
RStudio is another piece of free software you can download and run on your computer.2 Like R itself, RStudio is available for Windows, macOS and Linux.
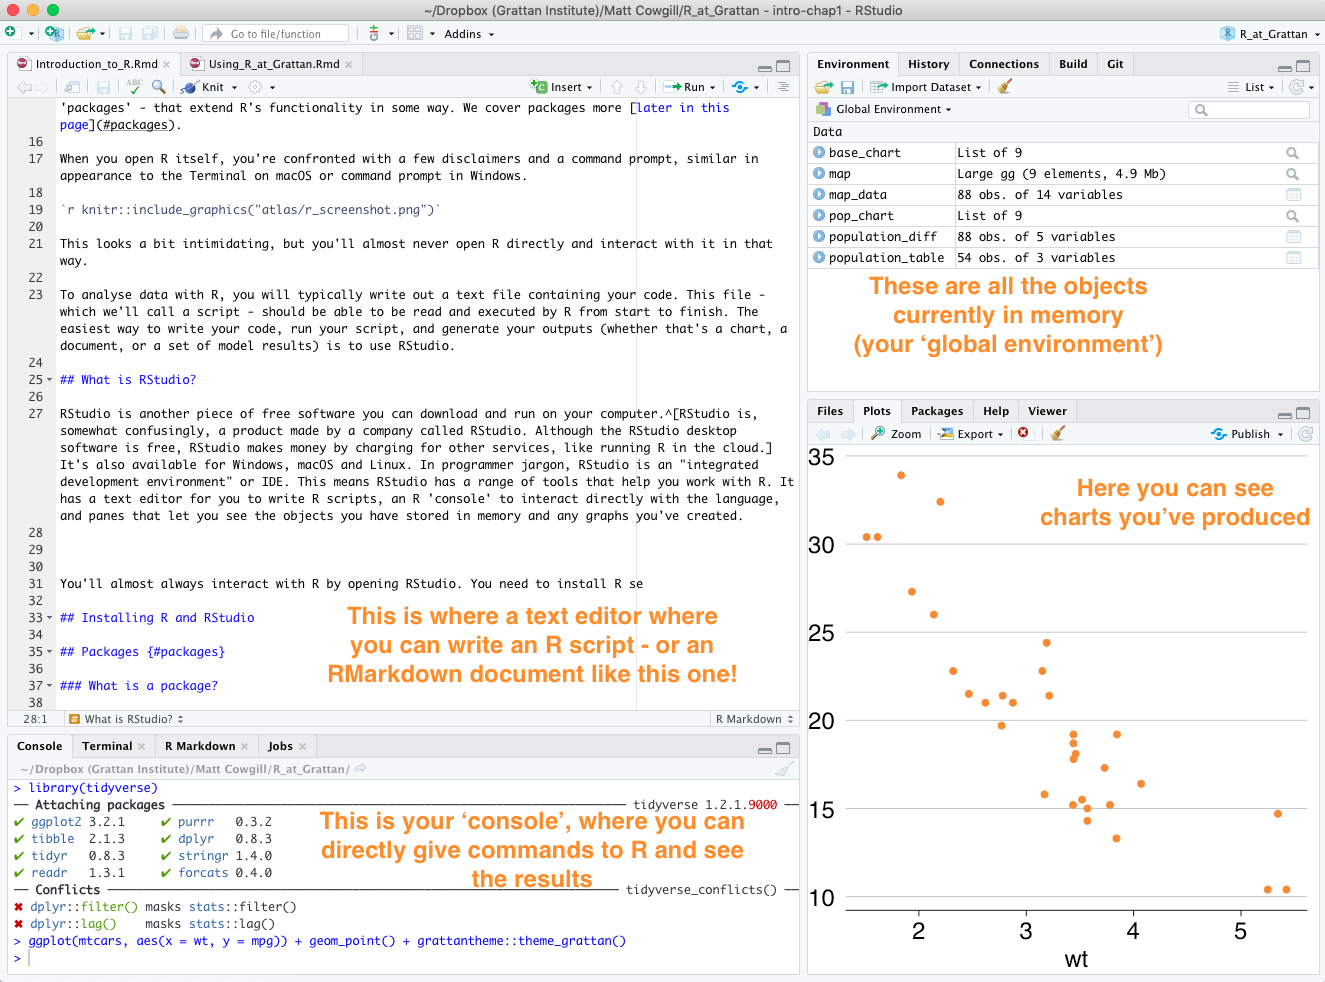
In programmer jargon, RStudio is an “integrated development environment” or IDE. Translated to English, this means RStudio has a range of tools that help you work with R. It has a text editor for you to write R scripts, an R ‘console’ to interact directly with the language, and panes that let you see the objects you have stored in memory and any graphs you’ve created, among other things.
You’ll almost always interact with R by opening RStudio.
1.3 Why use R?
We can break this question into two parts:
- Why use script-based software to analyse data?
- Why use R, specifically?
1.3.1 Why use script-based software?
It’s important for our analyses to be reproducible. This means that all of the steps that were taken to go from your raw data to your final outputs are clearly set out and can be reproduced if necessary.
Reproducibility is very important for quality control (“QC”), particularly of complex analyses - if it’s not clear what you’ve done, it’s hard for someone to check your work. It also makes things easier for you in the future - coming back to an old analysis a few months or years down the track is much easier if it’s reproducible. At Grattan, most of us rotate from program to program periodically – your colleagues will probably need to revisit your work at some point in the future, and they’ll thank you if it’s in a reproducible script.
Script-based analyses are more likely to be reproducible.3 A script sets out all the steps that were taken from reading in data, to tidying it, to estimating models or summary statistics and generating output.
Analysis that isn’t script based, like work done in Excel, is almost never reproducible. It is generally unclear what steps were taken, in which order, to go from the raw data to the output. It isn’t even always clear in a spreadsheet what is the ‘raw data’ and what has been modified in some way.
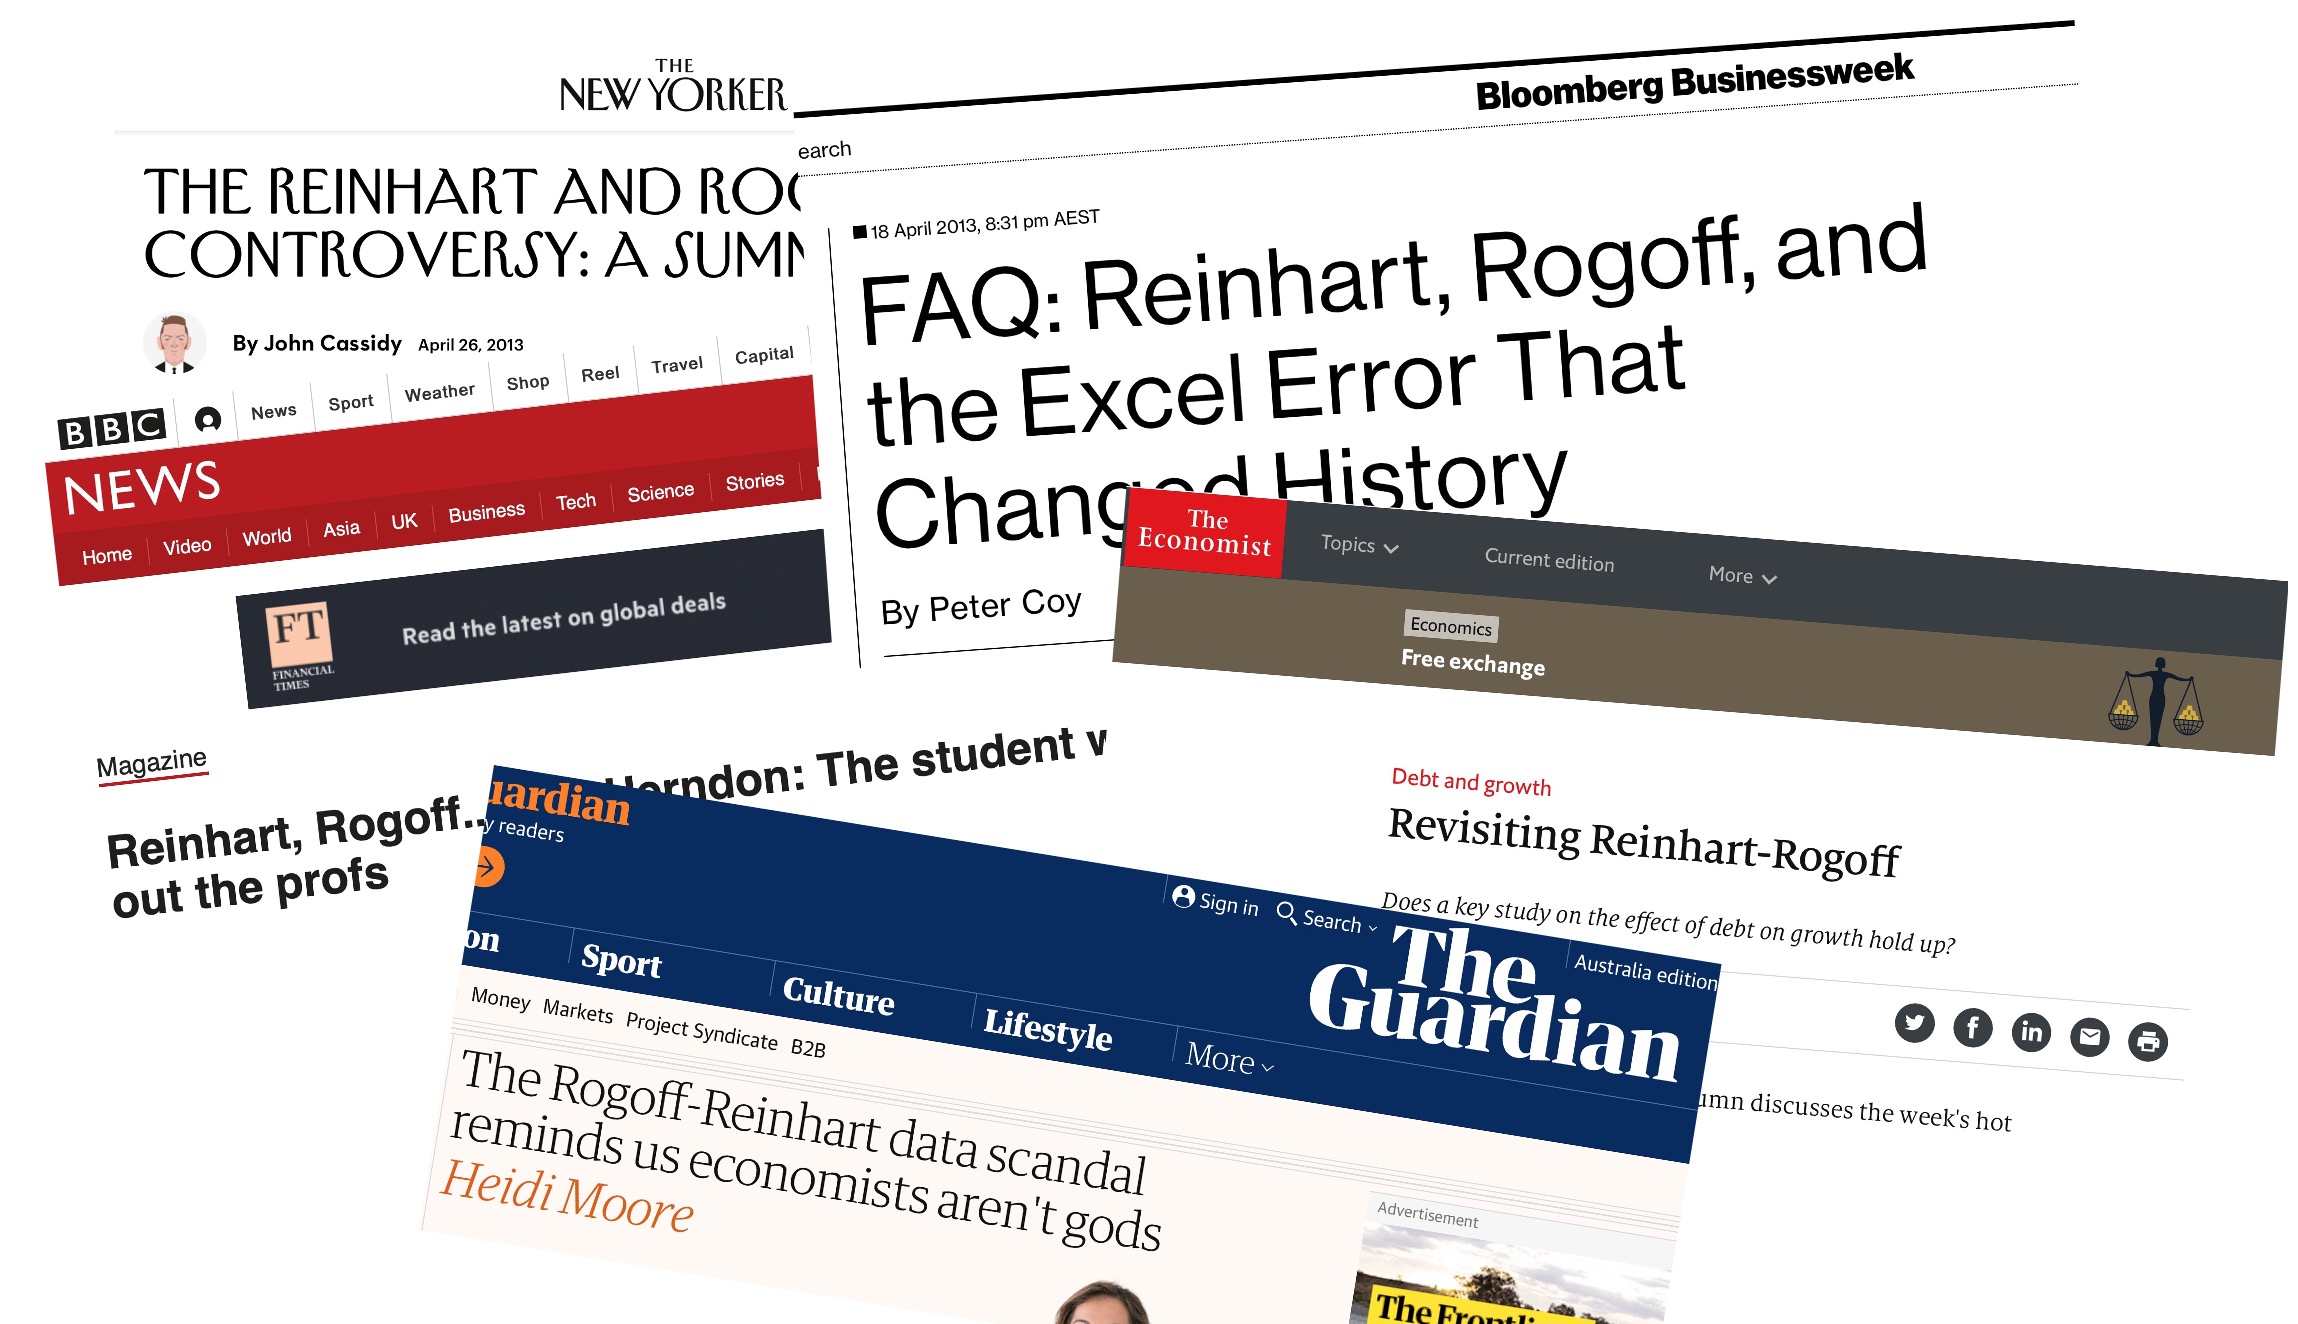
Using scripts makes us less susceptible to the sort of errors famously made by the economists Reinhart and Rogoff in their Excel-based analysis of the effect of public debt on economic growth. It’s still quite possible to make errors in a script-based analysis, but those errors are easier to find when the analysis is more transparent.
Script-based analysis software also allows us to:
- Work with larger data sets;
- Work with data in a broader range of formats;
- Easily combine different data sets;
- Automate tasks and build from previous analyses; and
- Estimate a broad range of statistical models.
1.3.2 Why use R specifically?
Doing reproducible, script-based, research doesn’t necessarily involve using R. It’s perfectly possible to do reproducible work in Stata or Python (though somewhat harder in SPSS, where data is often manipulated by clicking things).
We use R specifically because:
- It’s free!
- It’s open source.
- It’s powerful, particularly when it comes to statistics and data science.
- It’s flexible and customisable.
- It has an active community extending its capabilities all the time and providing support online.
- It can be used to make publication-quality graphs.
- It’s becoming the norm in academic research and more common in the corporate world.